

Heading into 2019 we look ahead to reducing pollution in the atmosphere to 6% of 1996 levels by 2050. 33% in 11 years. If we get there, then Kyoto may well be regarded as the single most important international agreement ever achieved.
After denouncing the Metro Vancouver’s regional plans as greenwash we articulated a concrete and verifiable analysis—a rational critique—of gaps existing in the plans. We avoided the ideological food fight of ‘mine are better than yours’ by tackling head-on the most concrete and verifiable claims in the regional plans: the air pollution problem. That analysis is presented here.
.

.
Preamble | Global Warming by the Numbers
This is a two-stage strategy for reducing Green House Gases (GHGs) in Greater Vancouver, British Columbia, to 6% of 1996 levels.
We don’t think it is possible to reduce GHGs to zero, in part because some GHGs are naturally occurring. And in part because the airplane fleet, for example, still does not have a practical alternative for using renewable fuels. For these reasons, we think in terms of ‘approaching GHG-Zero as a limit.’
Twenty years after the Greater Vancouver Livable Regions Strategic (1996) Plan published GHG emission levels—without reduction targets—and six years after Canada rightly exited the Kyoto Protocol, we took a hard look at the data. Here we upgrade those findings. What we found three years ago was nothing short of extra-ordinary. Projecting recent advancements in electric cars and solar panels we could ‘approach the GHG-Zero limit’ in two stages:
(I) Reduce GHGs by 66% (using available technologies).
(II) Eliminate them altogether.
Of course, our pedestrian approach to GHG-Zero is nowhere to be found in the Metro Vancouver 2006 Regional Growth Strategy or its 1996 predecessor. The Vancouver regional plans are all about building skytrain-and-towers imposed on the people by a centralized, un-elected regional governance structure (we deal with the need for regional government reform and an alternative urban form here).
Our ‘pedestrian approach’ to cleaning the air calls for an end to the ideological greenwash of invoking ‘climate change and global warming.’ The real issue in Greater Vancouver is that by 2016 houses were priced 12-times over median Canadian household incomes. While we recognize the need to end GHGs, we believe this can be done at the same time that housing is brought back where it was in 1986, at PAR with median household incomes.
Our two-stage approach to approaching GHG-Zero as a limit in Greater Vancouver begins by grouping the 1996 Livable Region Strategic Plan estimates for atmospheric pollution sources into four categories (1996 % share of GHGs):
1 | Transportation (31%)
2 | Urban Footprint (29%)
3 | Industry & Agriculture (29%)
4 | Trains, Planes, Trucking & Maritime Shipping (10%)
TOTAL: 99%. Below we discuss achievable reductions for each category.
.
1 | Urban Transportation: Net Reduction in GHGs—31%
Electric cars will knock off this ‘bad boy’ right off the top of the list. Done. Over.
Air pollution generated by private automobiles will go to zero. The only pollutant left to worry about will be the wearing out of rubber tires on pavements, and the particulates thus emitted into the air and left hovering over the urban footprint.
Today—for the first time in history—we can state with certainty that all transportation will run electric and on other alternative fuels. Airplanes remaining the sole exception.
Assuming that electricity is generated GHG-free—as coal, and natural gas electric plants are replaced by renewable energy sources—cars, buses, subways and trams will achieve a GHG-Zero transportation footprint.
Trucks, trains and ships are dealt with separately. Only the airplanes will be left burning fossil fuels.
Another big reduction in GHGs will come as the need to transport crude oil, refined petroleum and gasoline. With the drop in demand for oil products, the cost and pollution generated from transporting crude from the extraction to the refining sites, and then the pumping station disappears from the scene. Combined, these considerations lead to the first revolutionary result:
.
(1) NET GHG REDUCTIONS FROM URBAN TRANSPORTATION—31%
.
In other words, one-third of the pollution that is in the air today will go away as we switch away from oil for our personal transportation. The health benefits of this alone are hard to fathom and may take years to appreciate.
A gross error in the Vancovuer Regional Plans is building Skytrain to get people out of their cars, reducing air pollution by supposedly reducing automobile trips.
Here we face a paradox. We have been building Skytrain for 30 years and every year the number of cars on the road has gone up. Skytrain is simply NOT removing cars from the road. People prefer to drive rather than take transit for reasons of convenience.
Thus, the more agile solution is to design GHG-Zero vehicles of all classes and put an end to the construction of hyper-expensive towers-and-skytrain urbanism.
In all likelihood, road congestion will get even worse as the car fleet converts to electric. This heightens the need to design discrete urban footprints, towns and walkable neighborhoods where as many destinations as possible are clustered within easy walking distance of all front doors, including access to Modern Tram.
.
2 | Urban Footprint: Net Reductions in Air Pollution from Buildings—24%
The other part that the Greater Vancouver Regional Plans get wrong is promoting the construction of towers-and-skytrain as a way to end ‘sprawl.’ Elsewhere we discuss how ‘sprawl’ is just ‘bad’ urbanism, and the best way to fix that is to build ‘good’ urbanism.
We define ‘good’ urbanism as: walkable neighbourhoods, livable streets and affordable housing built from value-added renewable wood products in the human scale west coast vernacular.
Here we focus on a key problem with the Condo Economy: the industrial processes that produce concrete, steel and glass require high temperatures. In turn, maintaining these high temperature furnaces burns up a great deal of energy. Human scale urbanism, built of renewable, value-added wood products is the cleaner, more energy efficient alternative.
Municipal regulators should take note of this second category for achieving a GHG-Zero urbanism. It turns out our cities generate more air pollution than automobiles! Thus, the ‘enemy’ is just as likely to be found inside city hall as outside driving around in cars.
.
2.1 NET GHG REDUCTIONS FROM HOUSING & WORK PLACES—15%
.
The LRSPs 29% figure of GHGs released from cities is puzzling. In our region 93% of energy consumed is hydro electric and GHG-free. Thus, the LRSP number must originate from burning coal, oil and natural gas in furnaces that produce the massive amounts of building components required to build towers (see ‘Concrete’ below), than home heating, stoves, barbecues and fireplaces burning natural gas (‘clean burning’ natural gas releases half the amount of GHGs as other fossil fuels).
If the numbers in the regional strategy are correct, then reducing GHGs in our urban footprints can be achieved by switching fuels from natural gas to hydro, solar and wind. And from abandoning the regional plans that call for building towers-and-skytrain for human scale urbanism served by modern electric tram.
It’s a workable plan. Solar panels in our northern cities can generate about 40% of the domestic electrical requirements (but, maybe only 4 to 8% in winter). The renewable energy advantage for northern cities comes from the abundance of hydro electric resources and our ability to manage forest resources.
A challenge that still daunts us is drawing the energy from the rivers while returning salmon populations to pre-colonial levels. We see a combination of solar panels and human scale urbanism constructed from renewable building technologies achieving a 50% reduction in GHG-pollution from the urban footprint of our cities.
Achieving this reduction we factor in a return to the west coast vernacular, while ending the construction of concrete, steel and glass towers for offices and condominiums. That will still leave a great quantity of the leviathans around. A cap-and-trade system could incentivize hi-performance building envelopes and solar panels, while raising the cost of living and working in towers.
2.2 CONCRETE—4%
Concrete is a major generator of GHGs in our region (8% according to the LRSP). Towers are made entirely out of concrete, then clad in steel and glass. A return to the human scale urbanism built in the local vernacular is also a return to buildings made chiefly from renewable, value-added timber construction.
Shifting from concrete and steel towers to the human scale vernacular of the west coast tradition will easily cut the GHGs emitted from concrete in half while boosting the forestry sector at the same time.
2.4 A WILD CARD: SOLAR PANELS FOR NORTHERN CITIES—3%
Canada is a land where urban footprint is located almost entirely in northern latitudes. These are places with large fluctuations in daylight hours between summer and winter seasons. Yet, these places typically have abundant hydro resources from mountain streams and rivers. When solar arrays scale-up and prices plummet, BOTH home and business roof-mounted solar installations will pay for themselves in a mater of years not decades. At that point it is feasible to see a panel on every roof, and the amount of solar generated electricity achieving a significant scale.
A neighborhood of roofs, each with a solar panel connected to a ‘smart’ electrical grid, will in fact function like a giant solar array. The future here is not only promising, it is profitable. Each kilo-watt hour generated locally boosts the national GDP.
Further, the 2% loss to electric energy transmission slowly disappears as the greatest part of energy consumption is locally generated.
2.5 TOTAL URBAN GHG REDUCTIONS—24%
In the final analysis, within the urban footprint of our cities there is an array of measures for reducing air and water pollution that can be combined to produce a sizeable result in the overall reduction of GHGs:
• GHGs from buildings cut in half by switching fuel sources, building human-scale urbanism from value-added renewable forestry materials, and improving the thermal performance of building envelope, including retrofitting—reduced by 15%.
• Roof mounted solar panels making a quiet entry into the pollution sweepstakes—initially contributing clean energy at perhaps a marginal rate at say 3%—but scaling up to 20% and ultimately delivering 67% of domestic and small building energy demand in Northern Cities.
Incremental change in four sectors of the urban footprint net a reduction of one quarter of the pollution in the atmosphere (24%)!
To these must be added the ability in the natural environment to process some quantity of GHGs. We don’t include this in our calculations, preferring to leave it ‘on the table’ to smooth over any overestimates we may have made along the way. Our analysis is focused on pollution arising from human activity.
(2) 2030 NET GHG REDUCTIONS FROM URBAN FOOTPRINT—24%
Once more, prognosticating reductions of this magnitude being generated over the next 15 years puts in play the likelihood of achieving significant health benefits in the population at large in the near term. There are savings associated with that.
.
3 | 2030 Industry & Agriculture: Net Reductions in Air Pollution—14%
Turning to the industrial sector, different concerns come into focus in Greater Vancouver.
Here the low amounts of GHGs released reveal the weakened state of the industrial sector in the region, and the imperative to revitalize our industries. While cap-and-trade mechanisms have a proven track record for incentivizing industry to reduce pollution, the problem in our region seems to point in the opposite direction. We must find ways to breathe new life into our industries.
However, in dealing with industry generally, the issue revolves around the need to power furnaces to run processes that require great amounts of heat. Temperature levels that must be reached and sustained that require combustion. For this reason, a portion of the sustainable carbon footprint should be reserved for industrial processes. I consider this a better option that the profusion of atomic power where the ‘pollution’ comes in the form of radio active by-products with half-lives that stretch for centuries. Not only that, but the possibility for this material to be weaponized means that we must remain vigilant about reaching for atomic power generation as a crutch.
For the purposes of this discussion we will focus on key sectors of strength in Western Canada: fisheries, forestry, and mining.
First, it is not difficult to see niche potential in global markets for value-added wood construction products made from renewable forest products. Boosting forestry by fomenting human scale urbanism utilizing Western Framing Technology (the local vernacular) also generates employment throughout the province and region. Thus, the potential for employment of skilled workers and the growth of mom-and-pop businesses around the revitalization of the western vernacular building technology is highly promising.
Second, it is hard to imagine a better indicator for achieving environmental balance in our region, and province, than returning salmon populations to the pre-colonial levels. Restoring the fishery to its full natural potential would put money in the pocket of every British Columbian.
Third, extracting metals and minerals to build smart grid components—including batteries—will boost the mining sector to levels never before achieved.
Forestry and fisheries, for example, are bio mass intensive. So we should anticipate marginal increases in GHGs. Hence, I see the need to keep the industry numbers for GHGs unchanged or ‘capped’ at current levels anticipating a spike in greenhouse gases as the various enterprises in the industry sector make a come back.
• Tractors and earth movers, needless to say, can run on renewable fuels keeping those numbers near zero—dropping by 7%.
• GHGs from concrete cut in half, perhaps utilizing cap-and-trade mechanisms—dropping by 4%.
• GHGS from industry unchanged, anticipating a resurgence of industrial activity in the region without adverse pollution effects—no change.
.
WASTE MANAGEMENT & FARMING—3%
More good news here. Waste management is almost entirely in municipal hands—in the hands of the same people who crafted the Regional Plans. According to the LRSP waste management and farming release 9% of GHGs in the region.
Farming and waste management are GHG intensive because bio-mass is not only a potential fuel source and fertilizer, but it also releases high quantities of methane gas. You can smell it in the air near the farms and at the land fill sites. Methane released in the atmosphere is a ‘green house gas’.
On the farm the dung from cattle can be contained in barn buildings to some extent, the gases scrubbed and the bio-mass processed as either fertilizer or fuel. Farms, of course, can count on some amount of natural dispersion. Their distance from population centres is their ‘competitive’ advantage in this instance.
However, a different process is at work in tertiary water treatment. There, raw sewage is returned in just two forms: potable water and agricultural pellets, or fertilizer. A synergy presents here where processed urban waste returns to the farm as fertilizer pellets reducing the dependence on GHG-rich organic fertilizers. Farm co-ops, for example, could form to collect and process organic agricultural waste in tertiary treatment plants.
A measure not identified in the Livable Regions Strategic Plan—entirely in government hands and best handled at the regional governance scale—floats to the surface: obtaining potable water from processing raw sewage. This would finally put an end to the inane municipal practice of pumping raw sewage into the marine ecology, and pumping all water from great distances away.
• GHG release from waste management cut in half—falling by 2%.
• GHGs from agriculture—reducing by 1%.
.
(3) 2030 NET GHG REDUCTIONS FROM INDUSTRY—14%
.
4 |Trucking, Maritime Shipping, Railroads and Air planes: Net Reductions in Air Pollution—7%
Battery operated semitrailers are being tested right now in California. We see their adoption following along the precedent set by the taxi industry: fuel savings will drive the trucking industry to go electric by 2030, saving 4.5% of GHGs in this sector.
The final cipher in this dirty-air equation is merchant shipping. Here again, more good news. In April 2018 the International Maritime Organization (IMO) passed a strategy to reduce GHGs by 50% by 2050. Using technology transfer and innovation GHGs would reach zero by the end of the century.
However, there is a synergistic consideration that may or may not have been factored into these calculations. As already mentioned, as the vehicle fleet turns electric, the demand for oil will plummet, and the need to ship crude in super tankers will sunset.
Thus, with the sunset of the oil industry comes the bonus of GHG savings from NOT transporting its products to market. Thus, we see the 1.5% savings being achieved 15 years sooner.
With cap-and-trade incentives we see railways switching from diesel to electric engines saving 1% of GHGs in this sector.
A jet airliner burns 1,000 litres of fuel in 5 minutes. The number of flights per day in 2019 are estimated at 225,000 and growing. While the airline industry projects a 50% reduction in GHGs from the introduction of synthetic fuels, our inclination is to keep air flight related GHGs at par until new technologies come on stream.
By 2050 we expect 90% of GHGs either captured or eliminated from this sector.
(4) 2030 NET REDUCTIONS IN GHGs FROM TRUCKING, MARITIME SHIPPING, RAILROADS AND AIRPLANES—7%
.
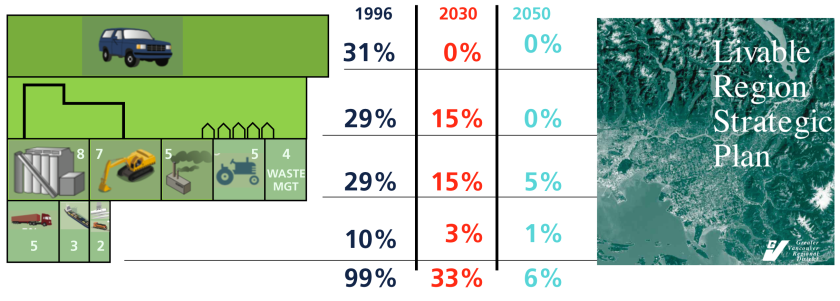
The Greater Vancouver Regional District estimates of emissions are shown in BLACK. Our projections for first stage reductions are shown in RED, and our second stage reductions are in LIGHT BLUE.
5 | Total Reductions—66%
The results from this analysis are shown in red and light blue in the figure above. At a glance they show how air pollution—or greenhouse gases—can be reduced by two thirds by a combination of government regulations and private sector innovation:
(1) Urban Transportation—31% net reduction in GHGs
(2) Urban Footprint—14% net reduction in GHGs
(3) Agriculture, Waste Management & Industry—14% net reduction in GHGs
(4) Long distance Transportation & Shipping—7% net reduction in GHGs
.
TOTAL NET REDUCTION IN GHGs—66%
.

Technological advances in electric engines, long-range batteries and international charging networks have unlocked the GHG-free future where the snow on Mount Baker will look white again.
The end of air pollution will not come until we see the sun set over the gas and oil industries. While this may trigger some economic shocks, we should expect some dividends.
The first will be a peace dividend. In the Middle East, where so much conflict has concentrated over the past 100 years, the time is approaching when the price of crude will fall to the point where it is no long worth fighting about.
Reducing air borne pollution by 66 percent in a decade, and 93% by 2050 will also return a health dividend. This will be a direct savings to government at the same time that it realized an unprecedented boost to the quality of human life and social functioning.
With the return of salmon to pre-colonial levels, the rise in mining for minerals to support the creation of the green energy grid, and the boom in demand for value-added forestry products from a return to the regional vernacular architecture, the region and the province will enjoy a very significant wealth effect.
Technological innovation has made possible a two-stage strategy for reducing GHGs presented above: Cut emissions by 66% before eliminating them altogether. Significantly, this transformation is accompanied by the hidden benefits and dividends are unprecedented impact and scope.
That is a regional strategy I can support!
